
 12 hours ago Markets and Prices
Bitcoin remains under pressure on Aug. 21, 2025, with prices trading at $113,326 amid a continued downward structure. With a market capitalization of $2.25 trillion and a 24-hour trading volume of $37.27 billion, bitcoin hovered within an intraday range of $112,460 to $114,723.
 Jamie Redman
Bitcoin
The daily chart indicates bitcoin has entered a bearish phase following a double-top formation near $124,517, which marks a strong resistance level. The current zone around $113,500 is notably lower, with trading volume declining steadily since the last peak. The pattern of lower highs and lower lows confirms the emergence of a downward trend, reinforced by a heavier volume of sell orders. Key support lies between $112,000 and $111,500, while resistance sits between $117,000 and $118,000. Traders considering long entries may look for a price bounce off the $112,000 level with rising volume and bullish candle confirmation.
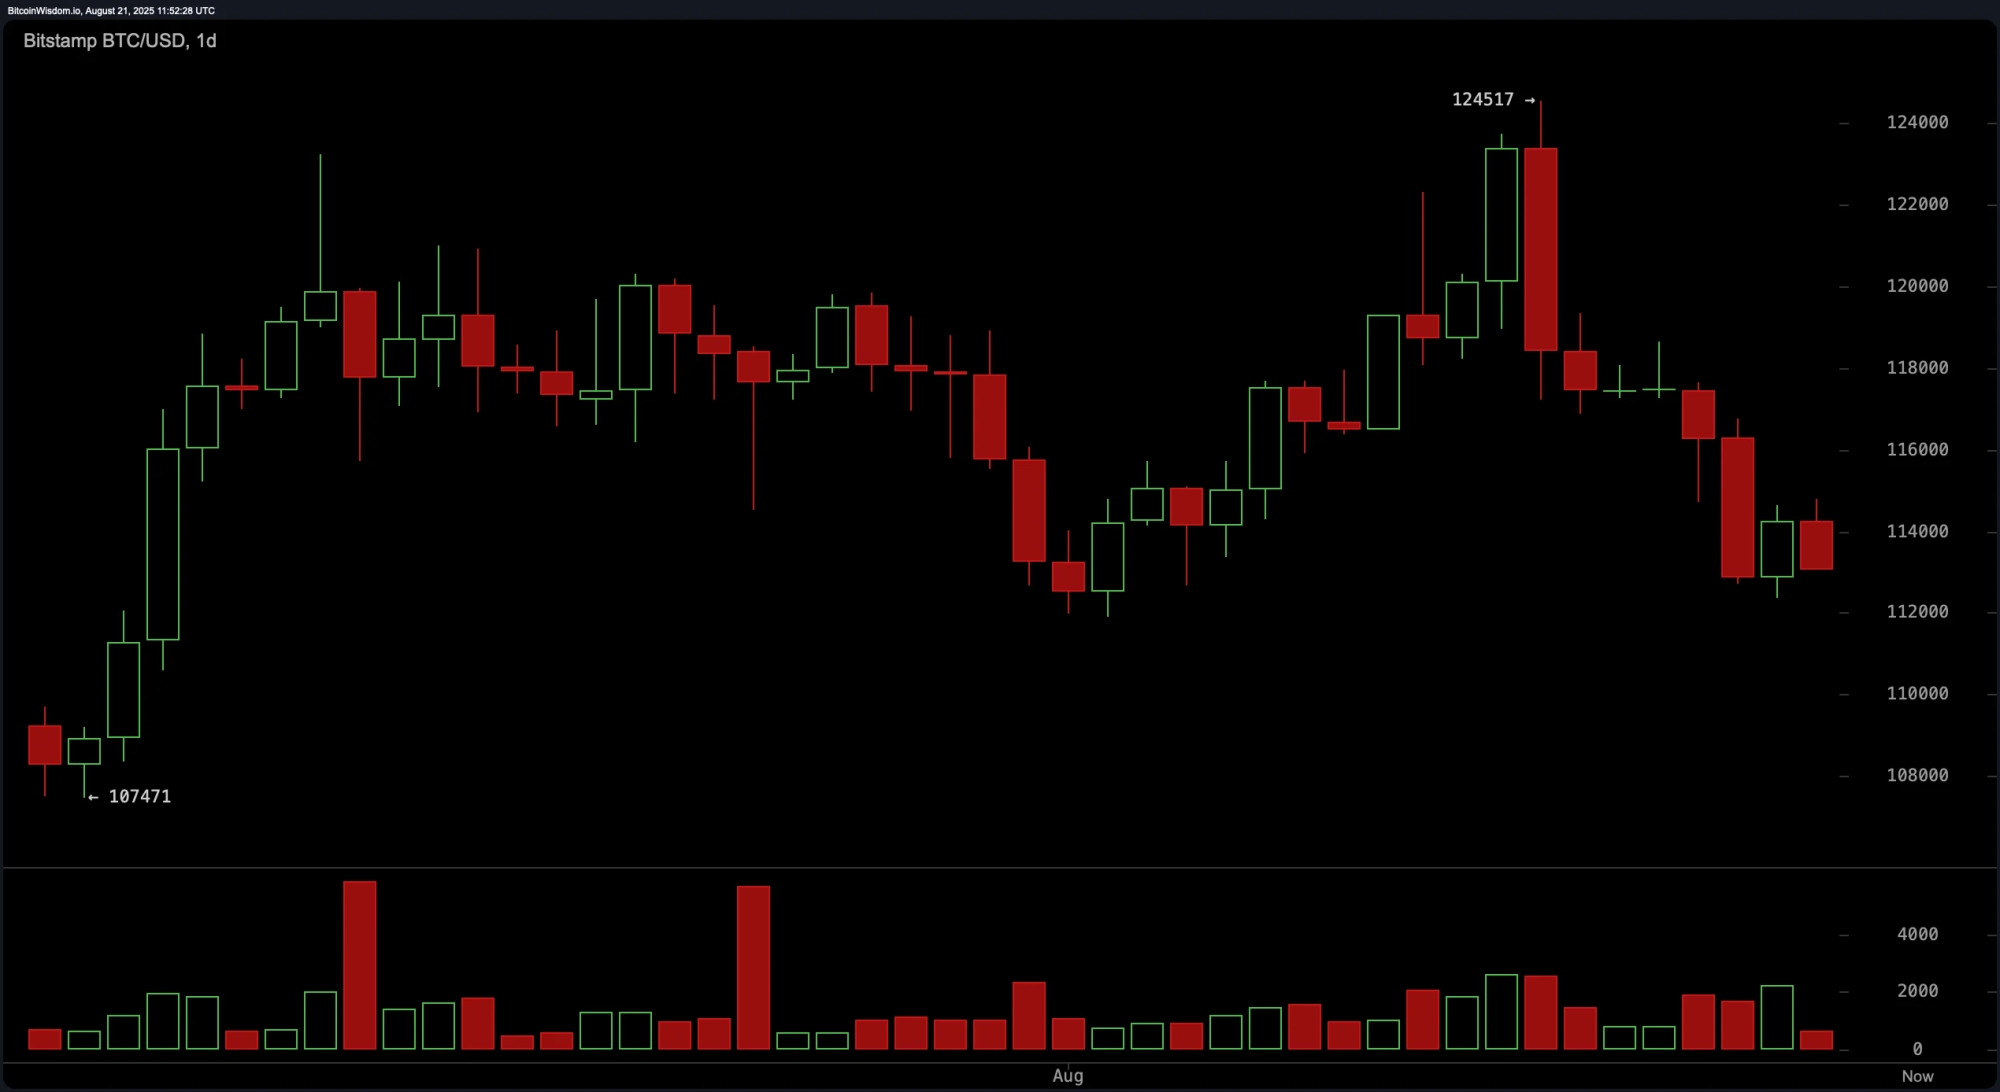 BTC/USD 1-day chart via Bitstamp on Aug. 21, 2025.
In the 4-hour timeframe, bitcoin experienced a strong sell-off after hitting the $124,517 mark, followed by a phase of mini-consolidation between $113,000 and $115,000. Despite attempts to rally, weak bullish candles with low momentum suggest a potential dead cat bounce. The local low of $112,353 remains a critical level, especially if retested on higher volume. A short position could be favored if price rejects the $115,000 zone, or on a confirmed breakdown below $112,000. A long entry remains plausible if the price stabilizes above $113,500 and establishes a higher low.
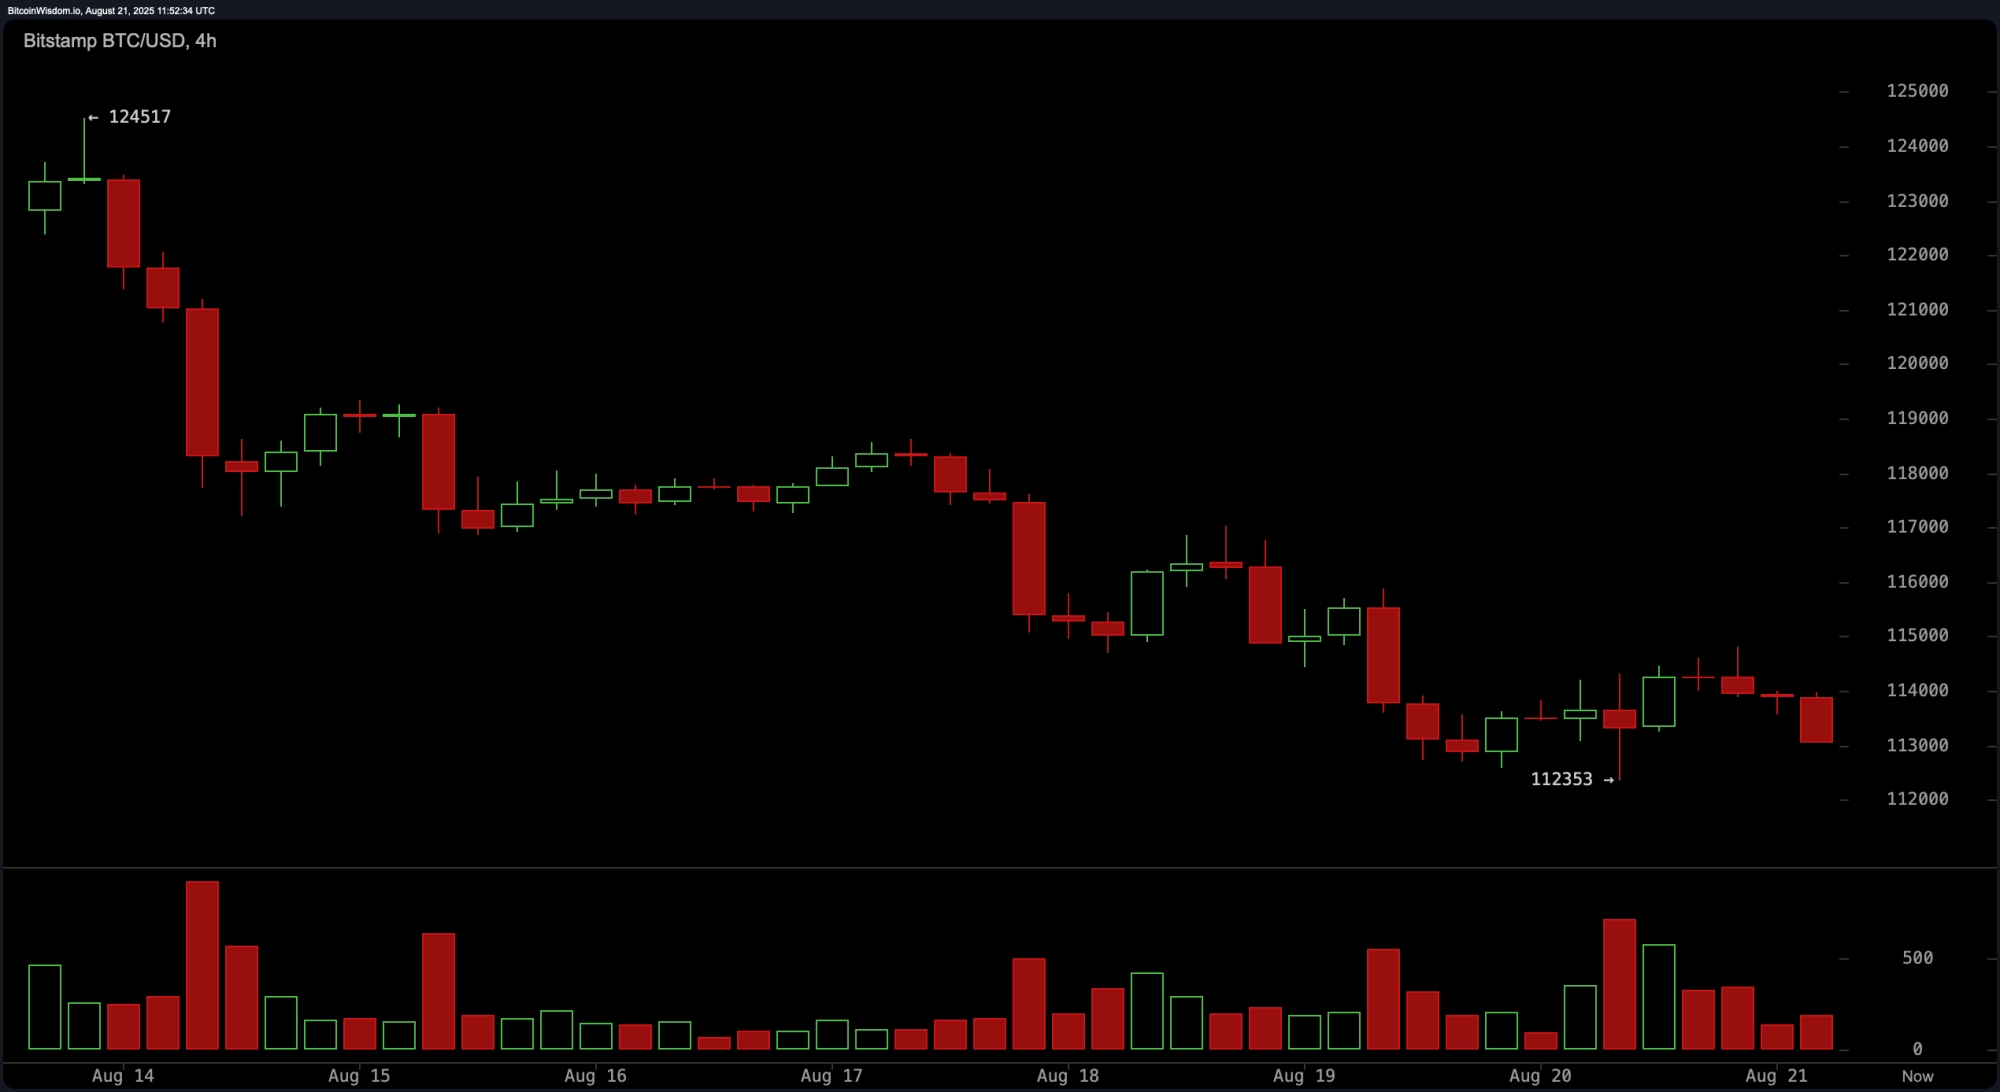 BTC/USD 4-hour chart via Bitstamp on Aug. 21, 2025.
The 1-hour bitcoin chart reveals a weak upward rebound from $112,353, with lower highs indicating sustained selling pressure. The short-term structure supports a bearish outlook unless bitcoin decisively reclaims the $114,500 level. Support between $112,800 and $113,000 presents potential for quick bounce trades, while resistance near $114,000$114,500 may offer shorting opportunities. Scalpers may benefit from tight stop-loss entries near resistance and exits within a 0.5% to 1.5% profit range.
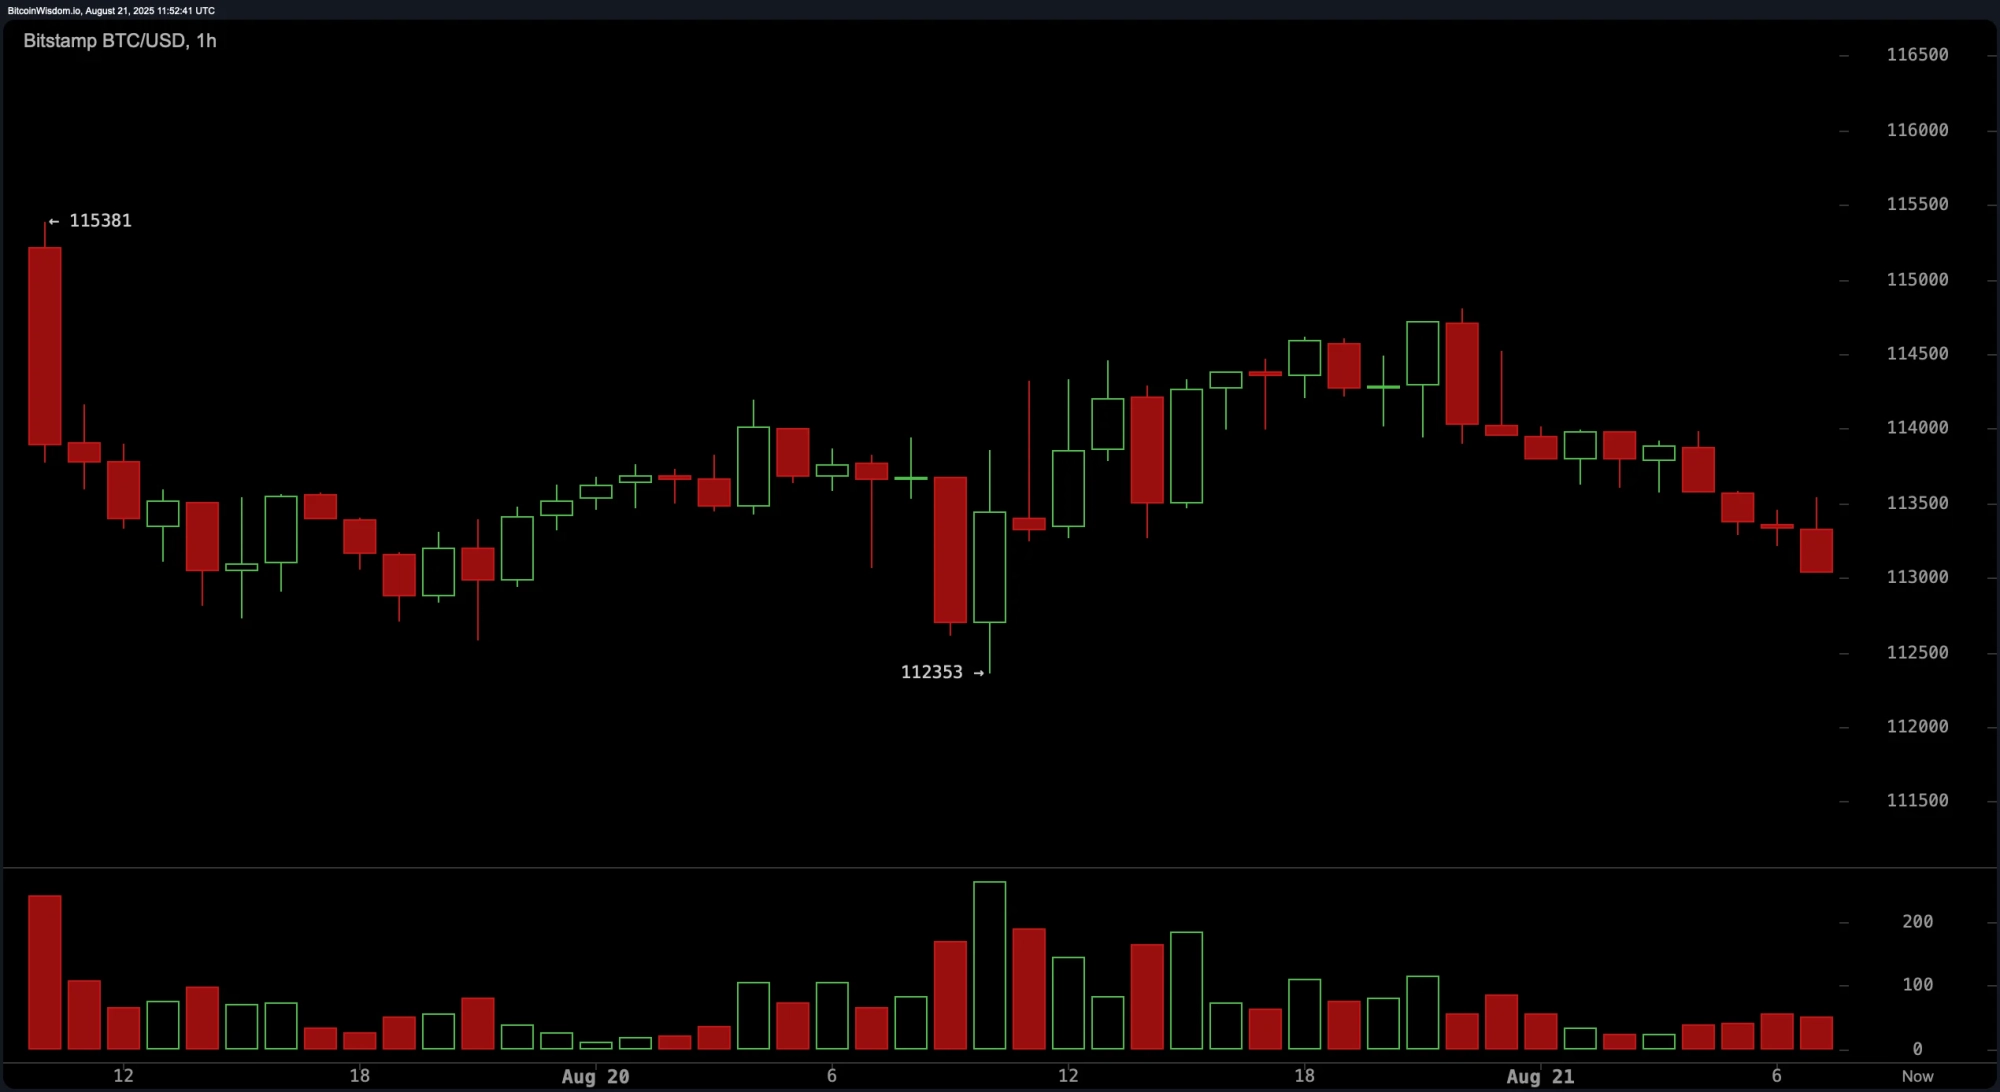 BTC/USD 1-hour chart via Bitstamp on Aug. 21, 2025.
Oscillator readings support a neutral-to-bearish sentiment. The relative strength index (RSI) is at 41, reflecting a neutral state. The Stochastic oscillator and the commodity channel index (CCI) read 8 and -92, respectively, both indicating neutrality. The average directional index (ADX) is at 18, confirming a weak trend. Meanwhile, the awesome oscillator is negative at -1,779, and the momentum oscillator signals selling pressure at -5,651. The moving average convergence divergence (MACD) level stands at -304, aligning with a bearish signal.
Moving averages (MAs) reinforce the bearish technical landscape too. The 10-period and 20-period exponential and simple moving averages (EMAs and SMAs) are all issuing negative signals, with prices trailing below all short- and mid-term levels. The 30-period and 50-period EMAs and SMAs also support a continued downside move. However, longer-term indicators offer a glimmer of support, as the 100-period and 200-period EMAs and SMAs suggest a buying trend, potentially cushioning a deeper correction.
Overall, bitcoin remains under technical pressure, with the mid-term trend clearly biased to the downside. While opportunities exist for both scalping and swing trades, traders are advised to await volume confirmation and monitor macroeconomic triggers or ETF-related developments that could drive abrupt volatility.
Bull Verdict:
If bitcoin successfully holds above the $112,000 support and confirms a higher low with increasing volume and bullish candlestick formations, a short-term rebound toward the $117,000$120,000 resistance zone is plausible. While the broader trend remains under pressure, a bullish reversal could take shape if key resistance levels are reclaimed with strength, particularly above $114,500.
Bear Verdict:
With bearish signals dominating the daily and intraday charts, and bitcoin trading below critical short- and mid-term moving averages, the path of least resistance remains to the downside. Failure to hold the $112,000 support may trigger further selling pressure, exposing the $111,500 and lower zones, especially if reinforced by rising volume and bearish momentum indicators.
Bitcoin (BTC) markets and pricesImage Credits: Shutterstock, Pixabay, Wiki Commons
1 day ago Markets and PricesAs of Aug. 20, 2025, bitcoin is trading for between $113,524 and $113,882 per coin over the last hour, with a 24-hour intraday price range between $112,647 and $115,789. The leading cryptocurrency commands a $2.26 trillion market cap and saw $45.41 billion in trading volume over the past day, as price consolidates near a crucial support level amid technical and macro headwinds.
 Jamie Redman
Bitcoin
Price action on bitcoins daily chart points to a clear downtrend following a sharp rejection at $124,517. This level marked the peak of a double-top pattern that has since triggered a series of lower highs and declining closes. A significant volume spike at the local high confirms distribution, while recent candles suggest hesitation at the $112,000$113,000 support zone. This level also aligns with prior demand and a short-term bounce, making it pivotal for potential reversal attempts. Failure to hold this support could open the door for a deeper retracement toward and below the psychological $110,000 level.
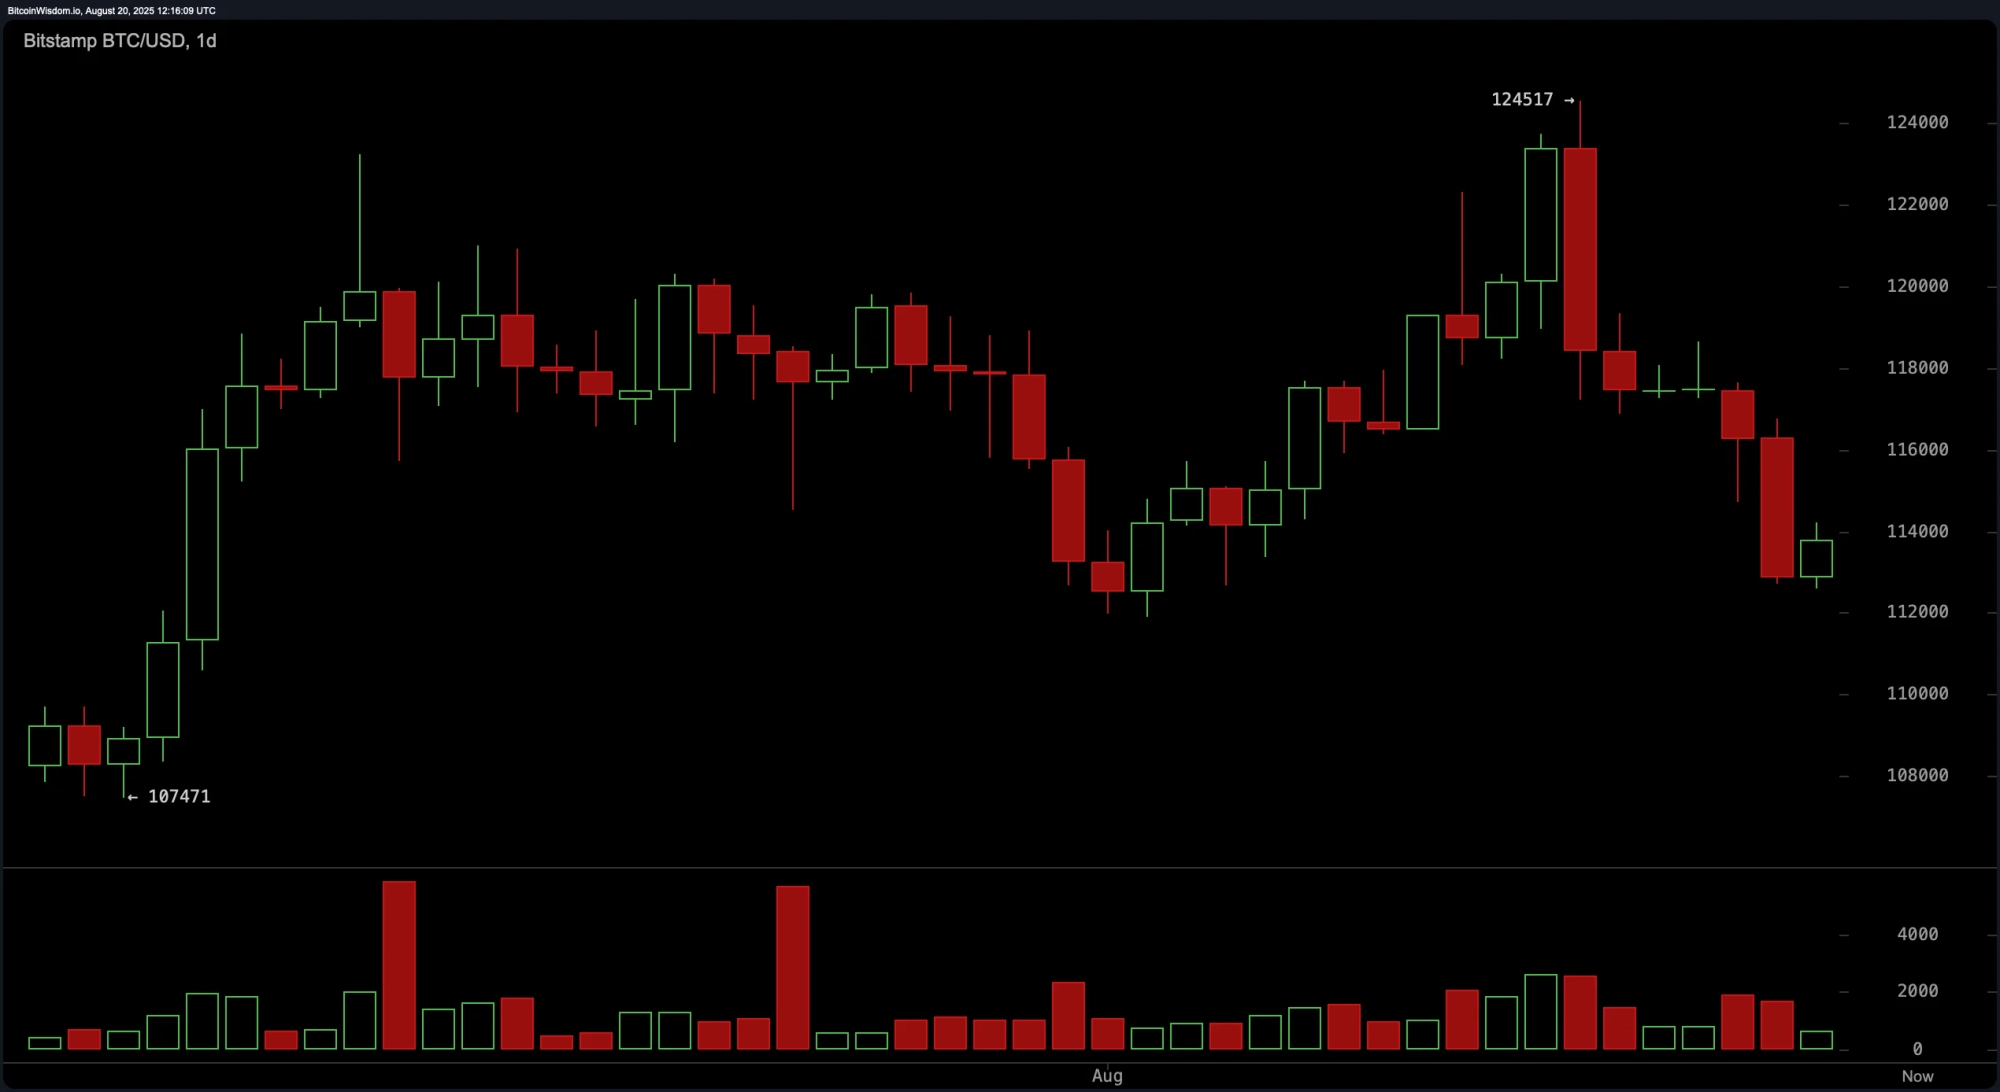 BTC/USD 1-day chart via Bitstamp on Aug. 20, 2025.
Mid-term signals from the 4-hour bitcoin chart continue to reflect a controlled downtrend channel that began on Aug. 13. A modest bounce from $112,580 has emerged, but remains unconvincing without a breakout above the $115,500$116,000 resistance band. Volume clusters around recent lows hint at possible capitulation, yet the absence of bullish momentum suggests caution. A sustained close above $116,000 would mark the first indication of a trend shift, while rejection from this zone could invite renewed selling pressure.
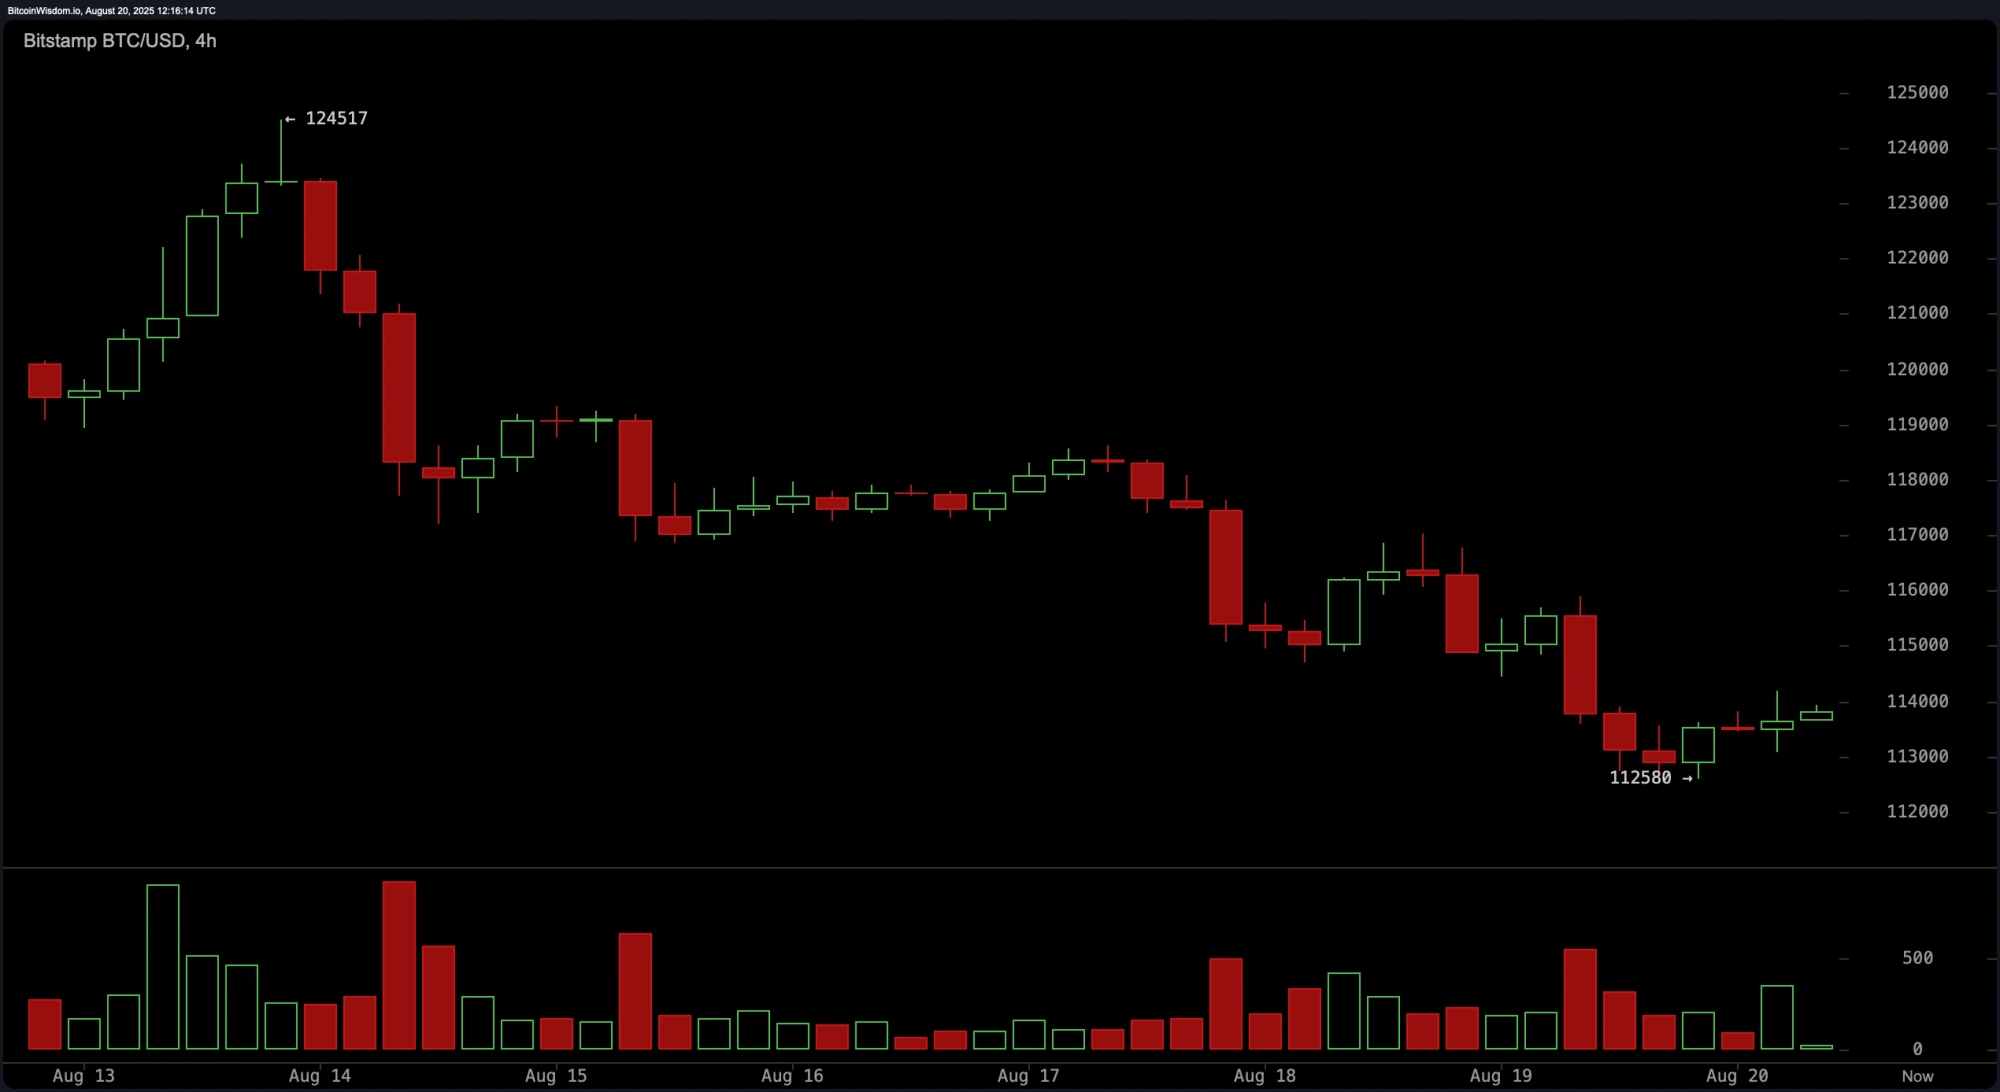 BTC/USD 4-hour chart via Bitstamp on Aug. 20, 2025.
Zooming into the 1-hour chart, bitcoin appears to be forming a potential bottom, with recent candles posting higher lows and marginally higher highs. The price remains supported around $113,000, with visible indecision reflected in declining volume. For short-term traders, range-based strategies may offer opportunities, particularly for scalping long entries near support and exiting near the $114,500$115,000 ceiling. However, should this upper boundary reject with strong volume, short positions could reassert dominance.
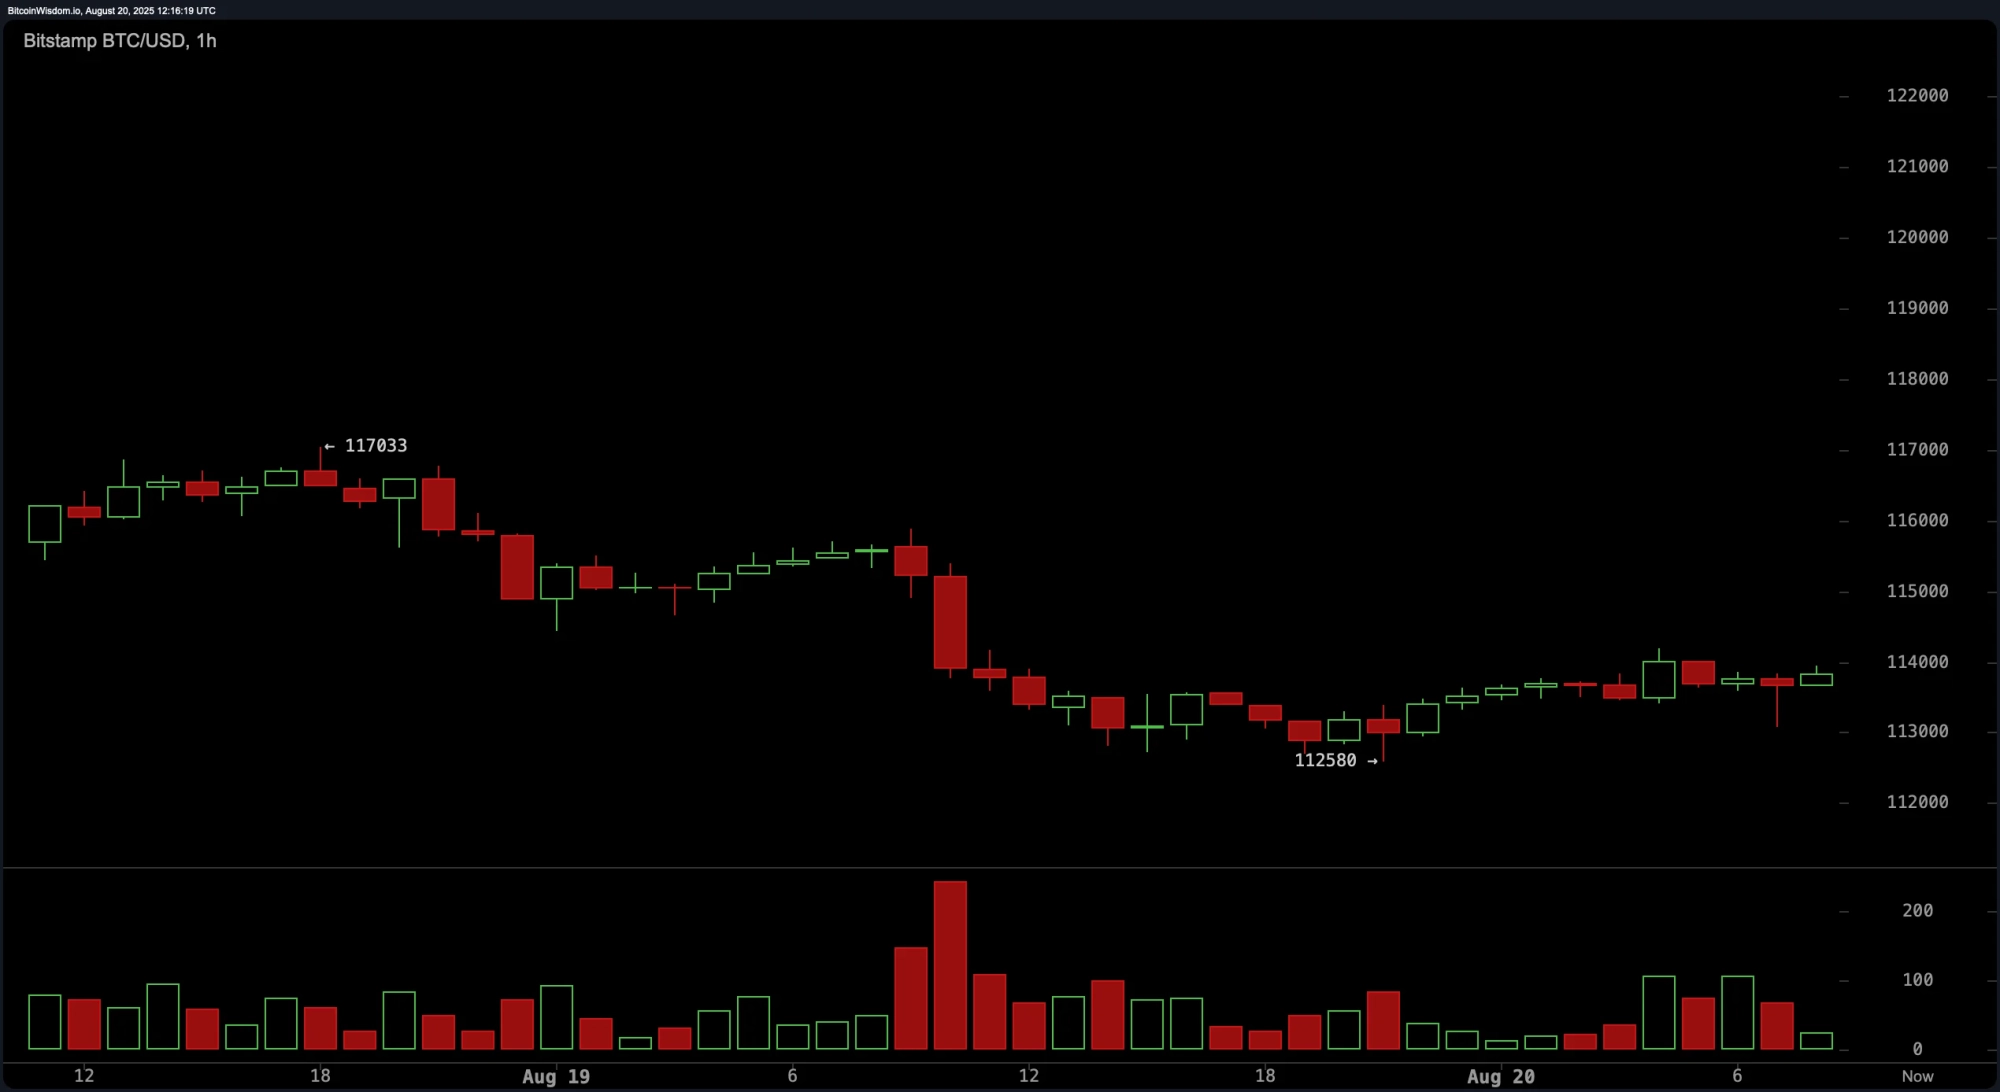 BTC/USD 1-hour chart via Bitstamp on Aug. 20, 2025.
Momentum indicators paint a mixed but slightly bearish picture. The relative strength index (RSI) sits at 43, indicating neutral conditions, while the Stochastic oscillator also reads 14, similarly neutral. The commodity channel index (CCI) at 96 and average directional index (ADX) at 19 reflect weak directional momentum. Notably, both the momentum indicator at 5,526 and the moving average convergence divergence (MACD) at 66 are flashing bearish signals, adding downside bias to the short-term outlook.
Bitcoins latest pullback reflects a combination of institutional repositioning, technical breakdowns, and the current investor caution in the air. Strategys announcement of eased share issuance restrictions fueled fears of dilution, dragging sentiment lower as its stock slid 7.4% against the U.S. dollar. At the same time, a breach of the $114,500 support level activated algorithmic sell orders and massive liquidations, compounding downside pressure.
Further, U.S. spot bitcoin exchange-traded funds (ETFs) posted $523 million in net outflows on Aug. 19, led by Fidelity and Grayscale, reducing market liquidity ahead of macroeconomic catalysts like Federal Reserve Chair Jerome Powells upcoming Jackson Hole address. Powells Jackson Hole speech is expected to significantly influence markets. If he signals prolonged high interest rates or a hawkish stance, equities, crypto, precious metals, and bonds may see volatility or declines. Conversely, hints of rate cuts or dovish comments could lift markets and boost investor sentiment.
Bull Verdict:
If bitcoin maintains support above $112,500 and breaks decisively through $116,000 with rising volume, the recent downtrend could give way to a mid-term recovery. A sustained close above this resistance would validate accumulation patterns and potentially initiate a retest of the $118,000$120,000 zone.
Bear Verdict:
Failure to hold the $112,000$112,500 support band, particularly under growing ETF outflows and bearish momentum, may accelerate downside toward $110,000 or lower. Without a clear bullish reversal signal, bitcoin remains vulnerable to continued selling pressure and broader market risk sentiment.
Bitcoin (BTC) markets and pricesImage Credits: Shutterstock, Pixabay, Wiki Commons

360% Bonus up to $100,000 + 400 Free Spins + 20% Rakeback | No KYC, No Withdrawal Limits =Q

200% Rakeback Bonus up to 10 ETH + 50 Free Spins

Playbet.io
130% up to 2,500 USDT + 200 Free Spins + 20% Weekly Wager-Free Cashback + No KYC + VPN-Friendly + No Maximum Withdrawals! | Bonus Code - FIRST

250% Welcome Bonus up to 1 BTC + 250 FS | Bonus Code - BITBETS

Up to 2500 USDT + 150 FS + Up to 30% Rakeback, All Cash No Rollover >

Instant Casino
200% Bonus up to 7,500 EUR + 10% Cashback

Lucky Block
200% Bonus up to �25,000 + 50 Free Spins | VPN Friendly | 24/7 Support

200% Bonus up to 1 BTC + 50 Free Spins + Free Sports Bet!

Golden Panda
200% Bonus up to 7,500 EUR + 10% Cashback

100% Bonus Up To 1 BTC + 10% Weekly Cashback + Weekly Free Bet - No KYC, Zero Fees, No limits >

200% Bonus, Instant Withdrawals, Best VIP Club, 100K daily Giveaways, Exclusive Sports Promos =%


