
Bitcoin is trading at $115,441 with a market capitalization of $2.29 trillion and a 24-hour trading volume of $47.99 billion. The intraday price range has spanned from $111,764 to $117,310, indicating tight consolidation after a recent sharp upward move.
 Jamie Redman
Bitcoin
On the daily chart, bitcoin appears to be consolidating near a critical support area between $111,658 and $113,000 following a pronounced rejection near the $124,517 swing high. A strong bearish candle marked the recent top, but it was immediately followed by a bounce off the low, supported by a notable increase in volumeimplying bullish absorption. A subsequent green candle with higher volume underscores the presence of buyers stepping in. However, upside targets at $117,000 and $124,000 may face renewed resistance unless momentum builds decisively from this level.
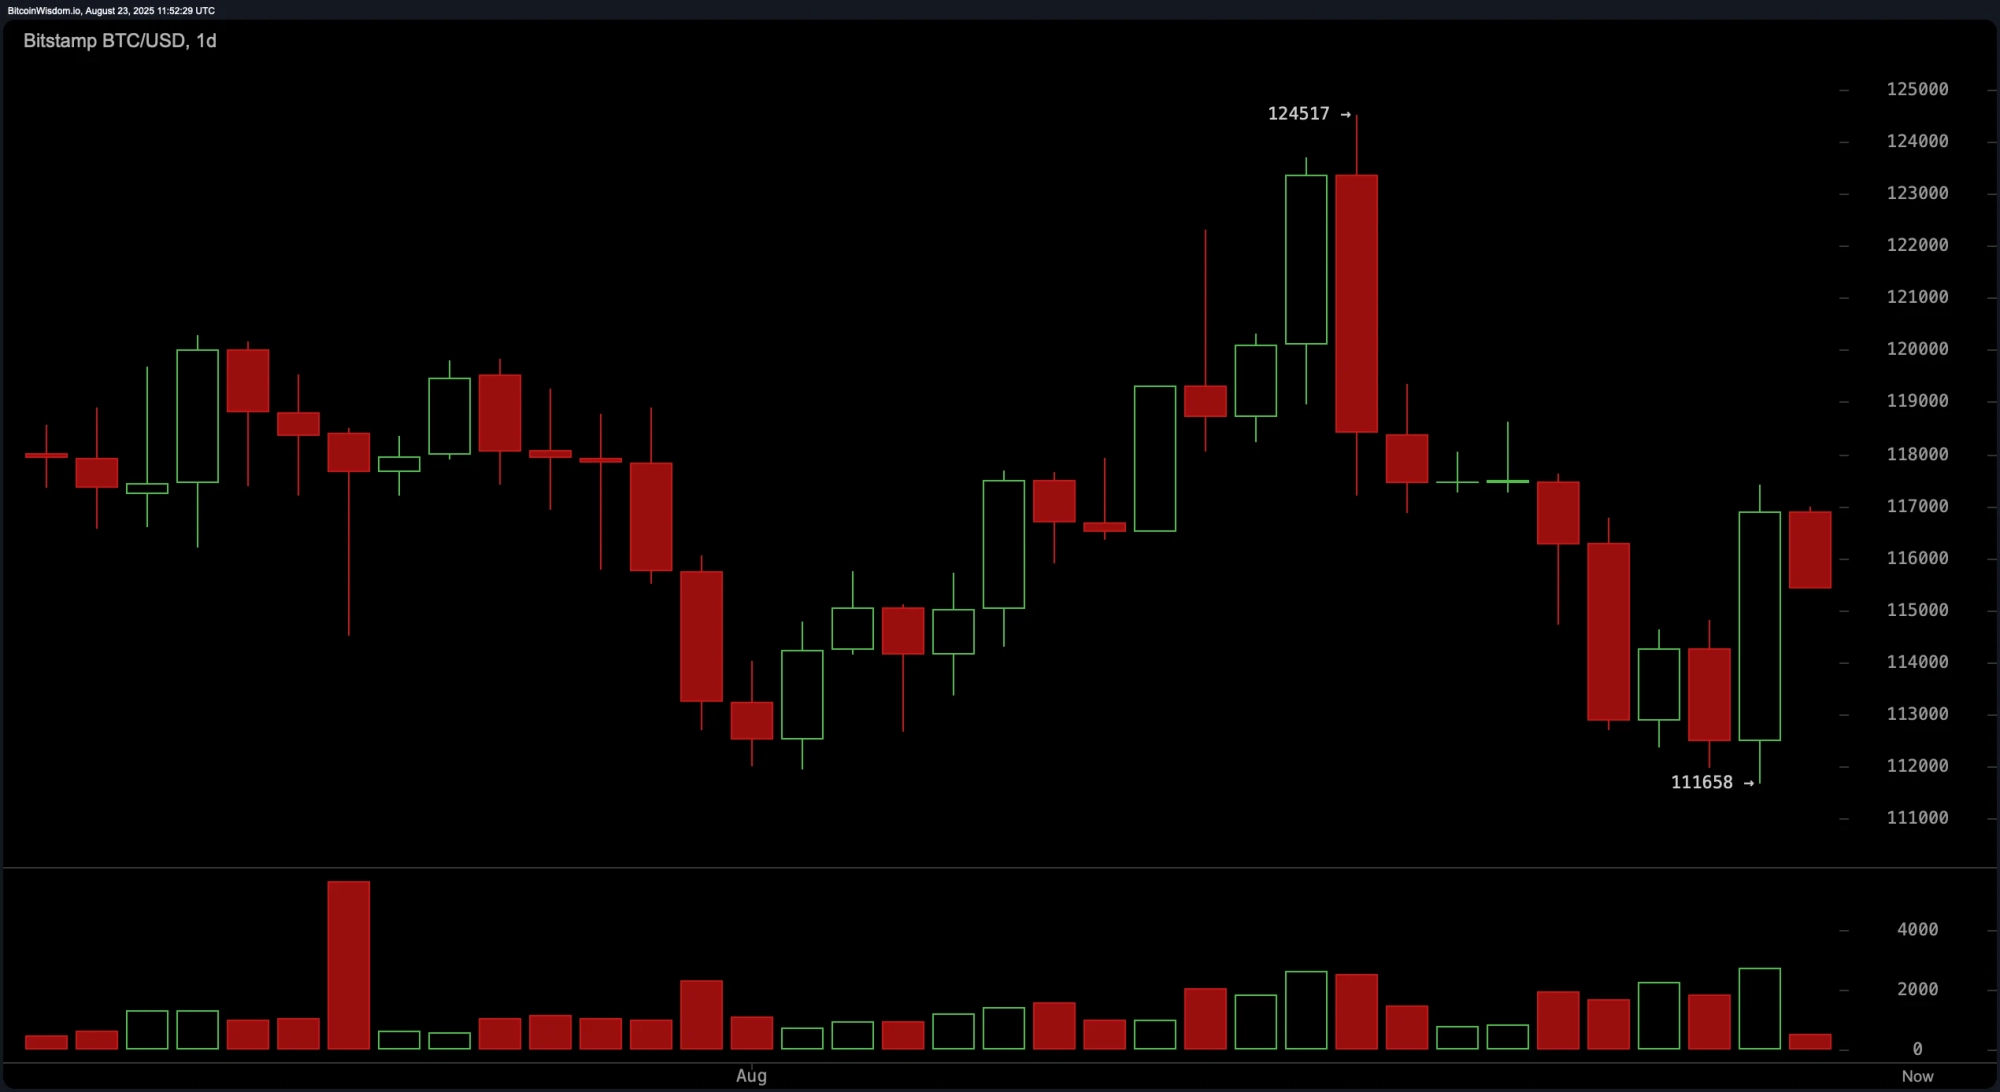 BTC/USD 1-day chart via Bitstamp on Saturday, Aug. 23, 2025.
From a four-hour bitcoin chart perspective, the leading crypto asset demonstrated a V-shaped recovery from $111,658, climbing to a high of around $117,500 before beginning to consolidate. The pattern now reflects lower highs with weakening volume, suggesting bullish exhaustion. Nonetheless, a re-test of the $112,000$113,000 range with sustained higher lows would validate a continuation setup. Immediate resistance lies near $116,000, with a secondary barrier around $117,500, provided the current trend structure holds.
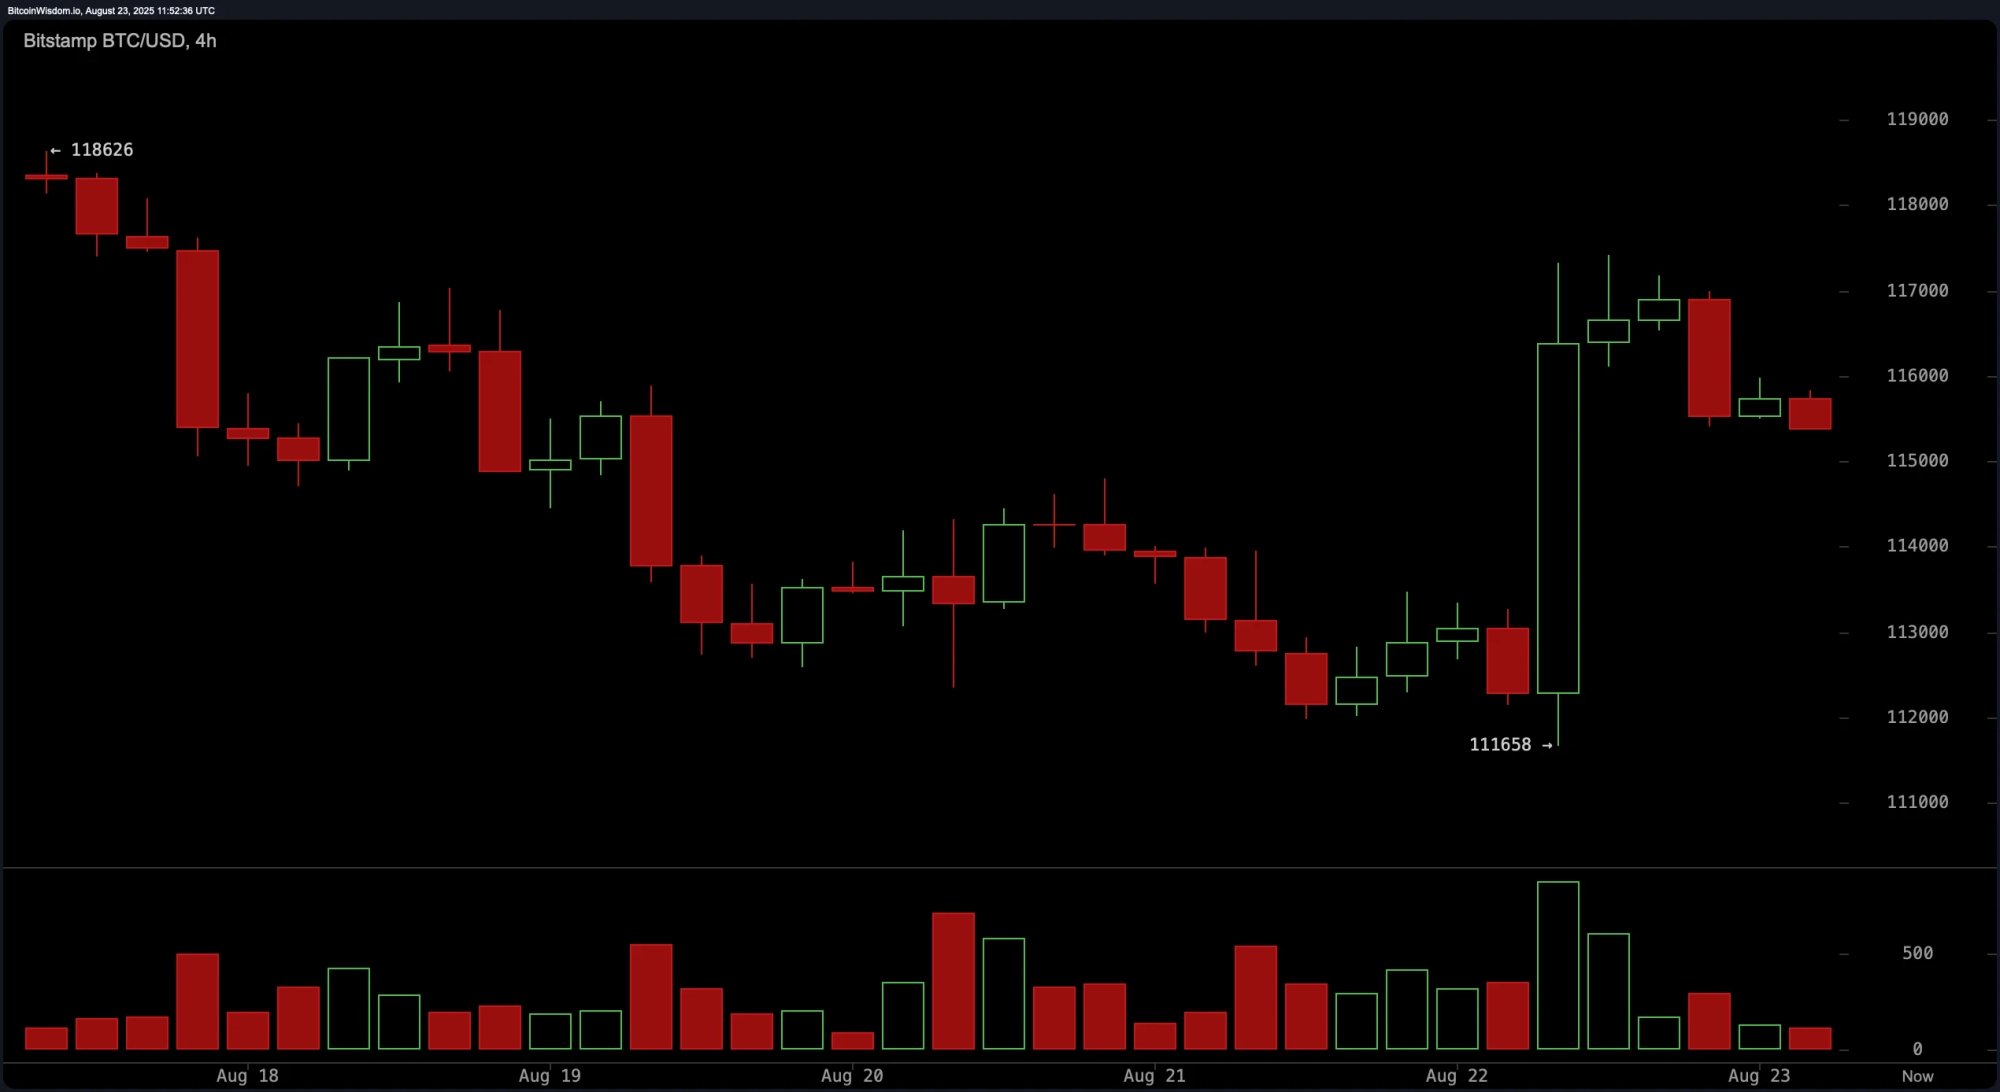 BTC/USD 4-hour chart via Bitstamp on Saturday, Aug. 23, 2025.
The hourly bitcoin chart reveals post-breakout behavior after BTC surged from $111,658 to $117,421 in a single bullish candle. Price action is now forming what could be a bullish flag or ascending triangle, a typical sign of continuation in strong trends. Mild pullbacks on low volume indicate limited selling pressure. A confirmed breakout above $117,000$117,500 on strong volume could prompt a rally toward $118,000 and potentially $120,000, assuming momentum remains intact. A stop-loss below $114,500 is recommended for short-term positioning.
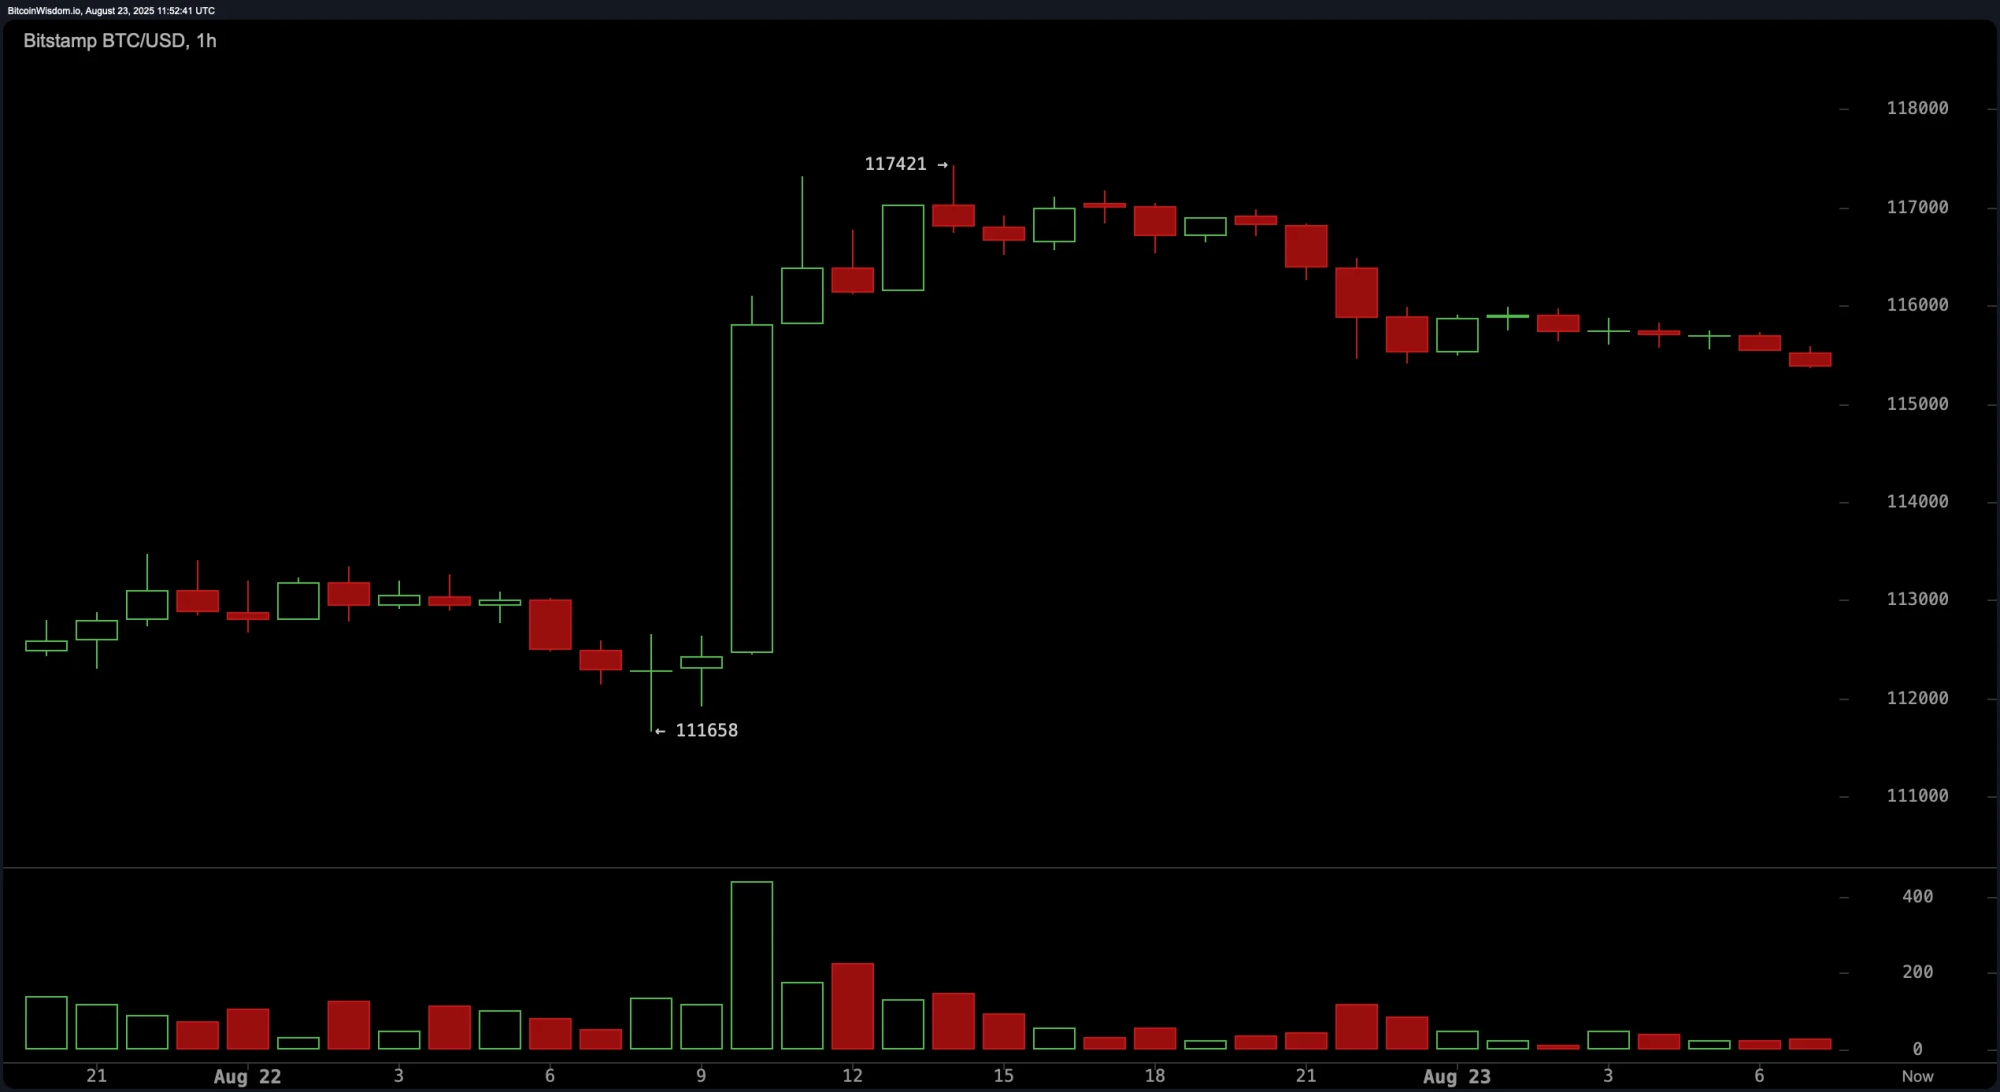 BTC/USD 1-hour chart via Bitstamp on Saturday, Aug. 23, 2025.
Oscillators currently reflect a cautious market tone. The relative strength index (RSI) is neutral at 48, while the Stochastic oscillator is at 25, also neutral. The commodity channel index (CCI) registers 29, indicating a lack of clear directional strength. The average directional index (ADX) is weak at 17, and the Awesome oscillator is negative at 2,400, though both signal neutrality. More notably, the momentum indicator stands at 7,937, and the moving average convergence divergence (MACD) level is at 281both signaling bearish divergence.
The moving averages (MAs) paint a divided picture. Short-term averages, such as the 10-day and 20-day exponential moving averages (EMAs) and simple moving averages (SMAs), are all signaling negativity. In contrast, longer-term indicators like the 100-day and 200-day EMAs and SMAs continue to indicate a buying trend. This divergence highlights short-term uncertainty within a longer-term bullish structure, suggesting traders should watch for confirmation before committing to trend continuation plays.
Bull Verdict:
If bitcoin maintains support above the $111,658$113,000 zone and breaks above $117,000 with strong volume, the broader trend remains intact, favoring a move toward $118,000 and potentially $124,000. The structure across all timeframes supports a bullish continuation, especially with longer-term moving averages still in buy territory.
Bear Verdict:
If bitcoin fails to hold above the $111,658 support level and dips below $111,000, it could trigger a broader correction toward lower levels, negating the recent recovery. Weakening momentum indicators and bearish short-term moving averages raise the risk of downside acceleration if support is lost.