Lightning Network data reveals a clear pullback in both capacity and channel count over the past year. As activity thins out, the network is showing stronger pockets of centralizationclustered around a handful of node operators, specific server hosts, and dominant geographic hubs.
 Jamie Redman
Lightning Network Contracts: Data Reveals 30%+ Drop in BTC Capacity
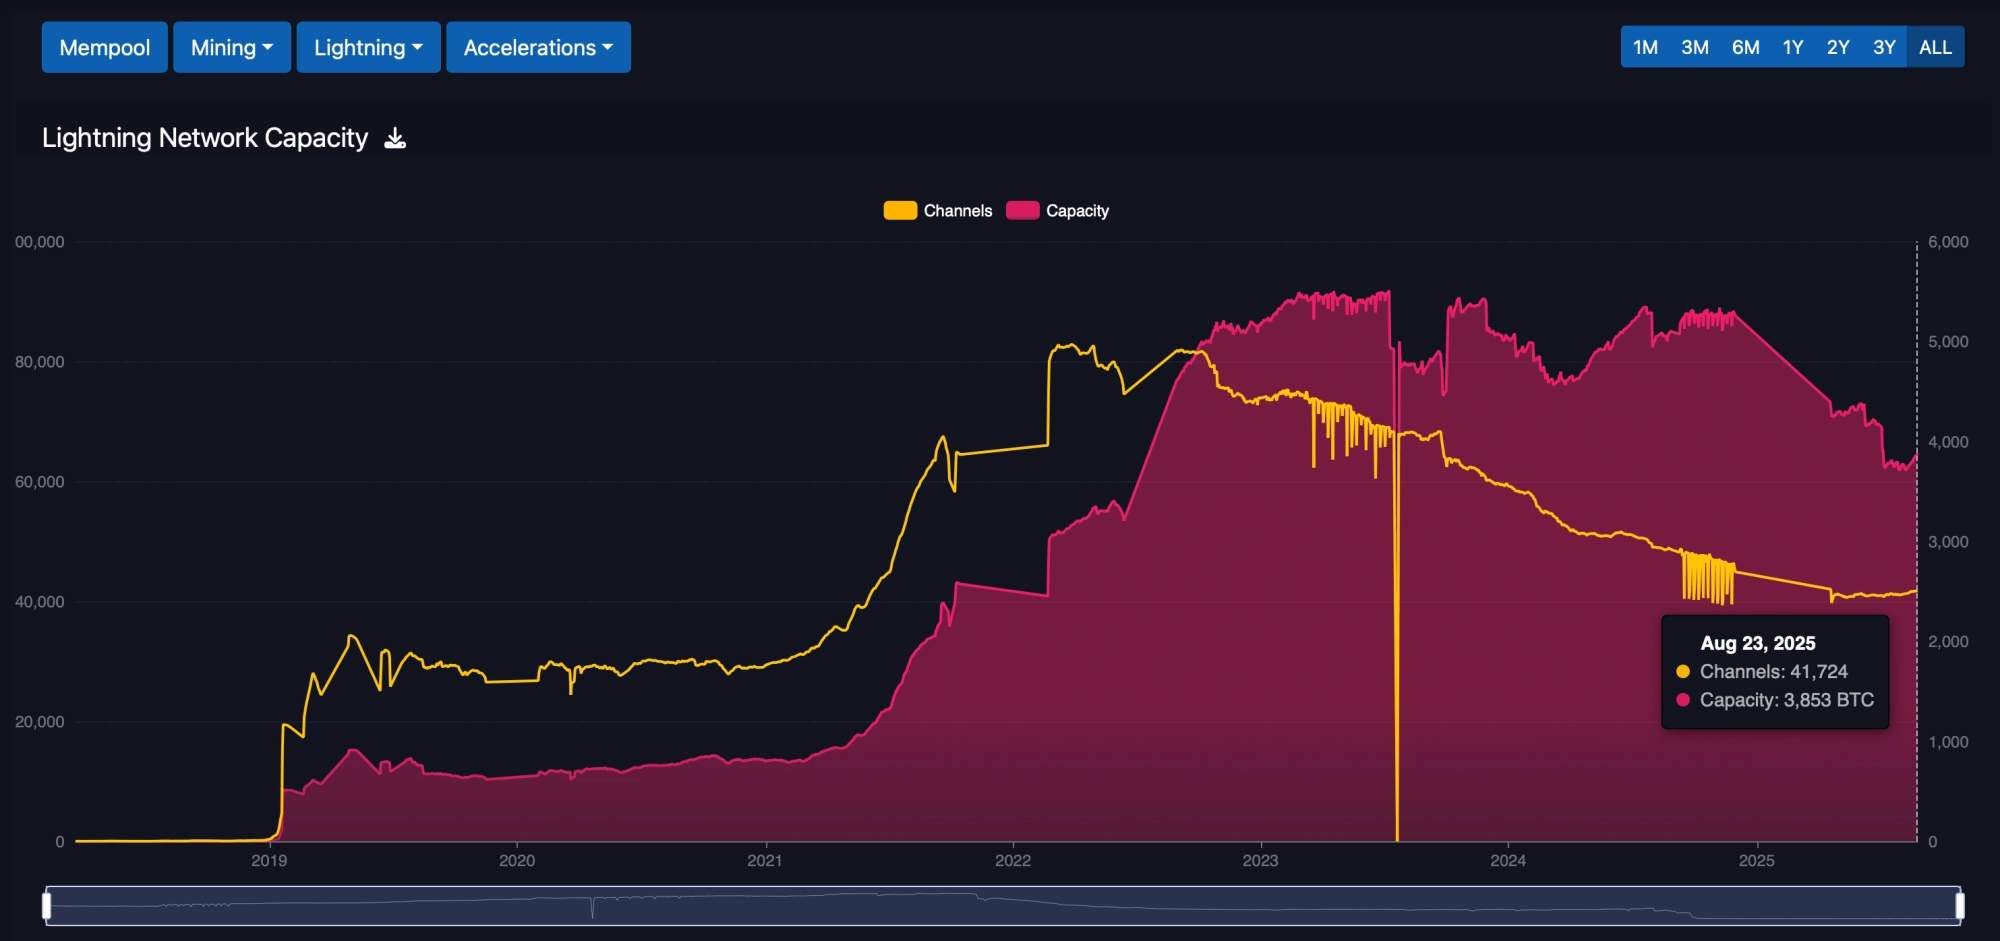
The most visible decline is in total capacity. As of Aug. 26, mempool.space data shows Lightning capacity ranging from 3,850 to 3,870 bitcoin over the span of Aug. 2324, 2025. Thats down from about 5,300 to 5,500 bitcoin one year prior, marking a drop of roughly 1,500 to 1,700 bitcoinabout 30% to 35% below mid-to-late 2024 levels.
 Source: Mempool.space
The downward trend has been persistent, with only brief pauses along the waypointing to a consistent slide rather than a single event. Channel counts have dropped, too. On Aug. 23, 2025, the number stood at 41,724 channels. In mid-2023, Lightning had more than 80,000 channels at its peak, so the current figure sits at about half the prior high.
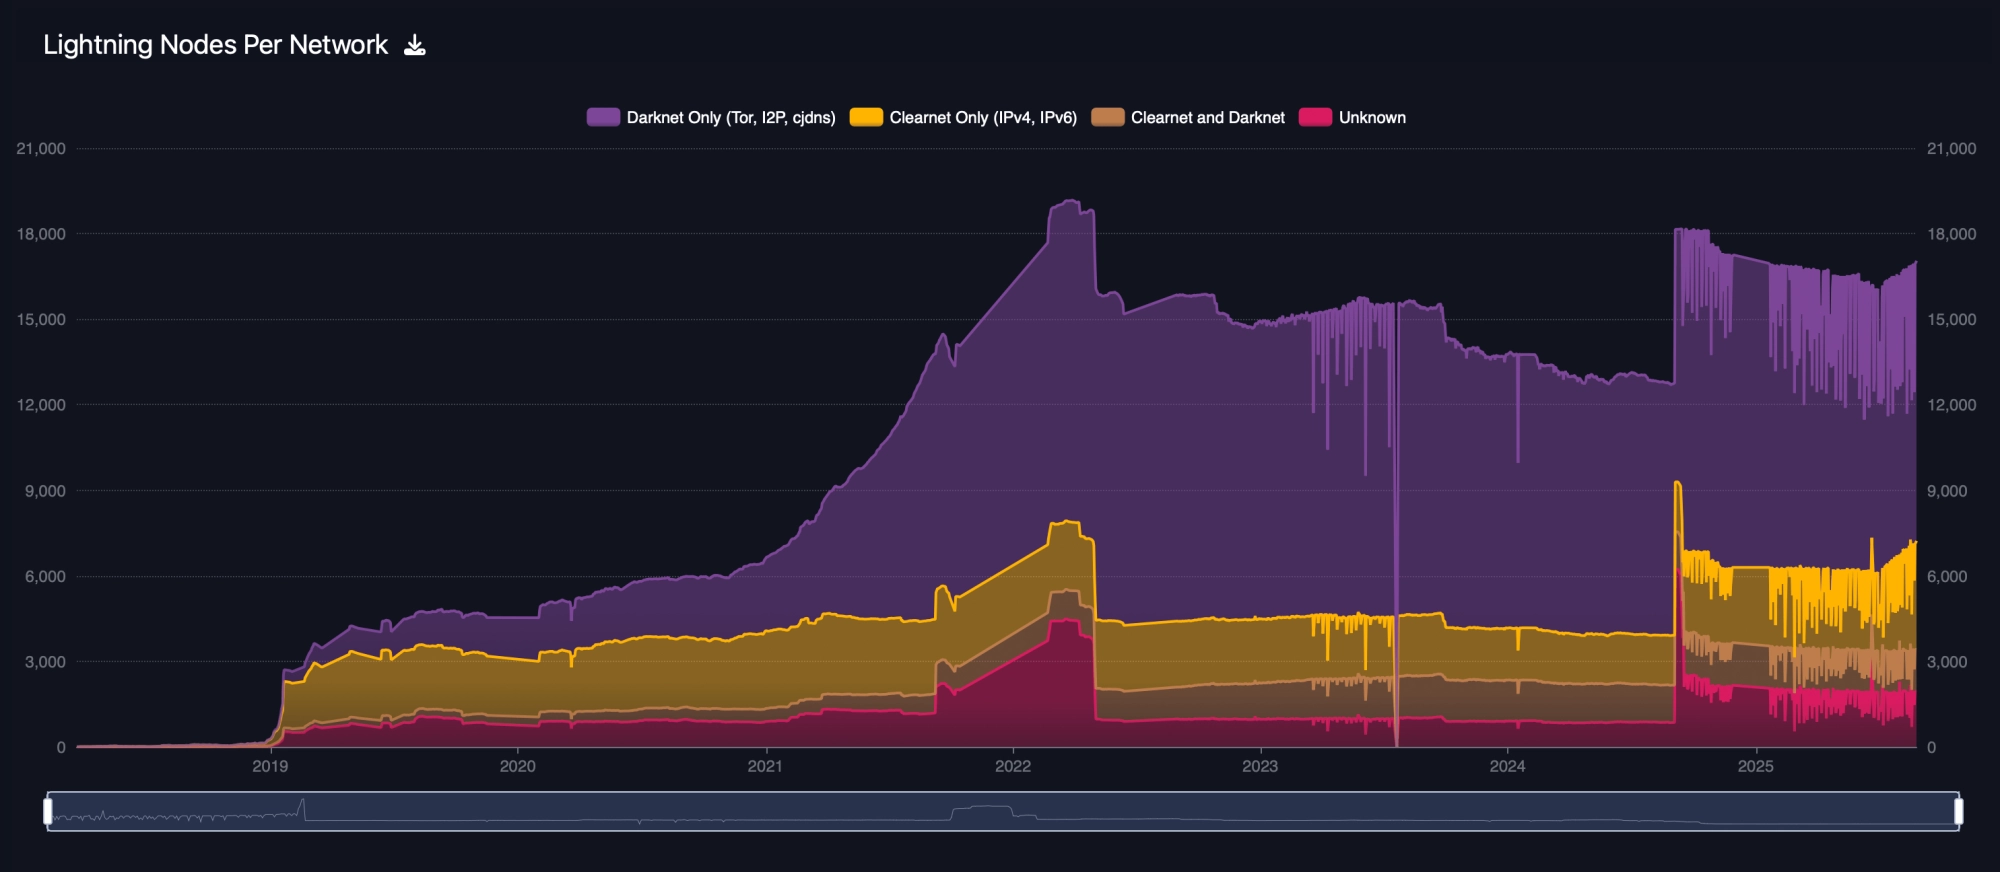
The descent has been steady through most of 2024 and into 2025, with only minor stretches of stability. A shrinking number of channels also means fewer possible routes for payments, even if overall capacity remained the samewhich it hasnt. In this case, both capacity and connectivity are weakening together. Meanwhile, privacy-focused routing still dominates Lightnings transport layer. Most nodes continue to favor anonymity networks over public channels.
 Source: Mempool.space
Mempool.spaces data shows the largest share of nodes operating via darknet transports like Tor, I2P, or cjdns. Clearnet-only setups represent a smaller portion, while nodes combining clearnet and darknet remain a minority. Though the mix shifts slightly over time, the darknet sector stays on top well into 2025suggesting many node operators lean toward privacy or simply prefer to steer clear of clearnet exposure.
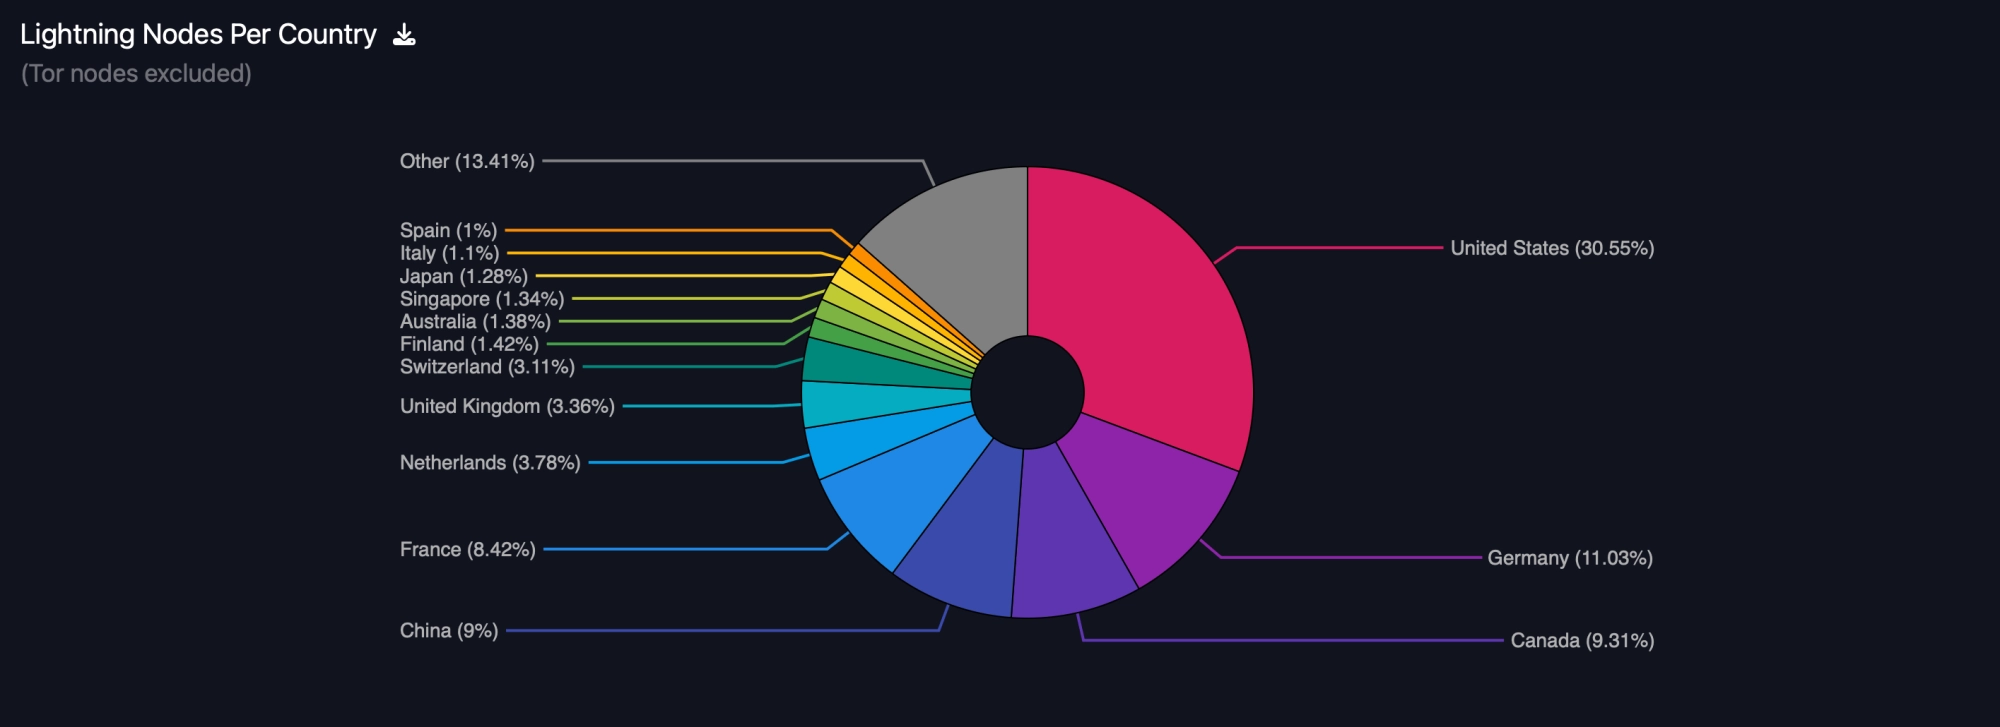
The Lightning Networks node map is tilted sharply toward a few countries. Stripping out Tor-only nodes, the United States leads with 30.55% of clearnet-visible nodes, totaling 3,819. Germany follows with 11.03% (1,379), trailed by Canada at 9.31% (1,164), China with 9% (1,125), and France at 8.42% (1,053).
 Source: Mempool.space
Finishing out the top ten are the Netherlands with 3.78% (473), the United Kingdom at 3.36% (421), Switzerland at 3.11% (389), Finland with 1.42% (178), and Australia at 1.38% (173). The rest of the world is divided into smaller fractions.
This distribution hints at where operators feel confident revealing infrastructure over the public Internet. The U.S., Germany, and Canada make up the core of that group, while others appear more inclined to conceal node locations behind Tor.
Liquidity Concentrated in a Handful of Hubs
Liquidity across the Lightning Network is funneled through a small circle of heavyweight hubs. ACINQ tops the list, managing 445.78 BTCabout 11.5% of the networks totaland maintaining 2,245 channels. Binance trails with 306.14 BTC over just 136 channels, while Bitfinexs bfx-lnd0 handles 305.97 BTC through 642 channels. Kraken follows close behind, holding 263.13 BTC spread across 1,168 channels, and block adds 209.87 BTC via 493 channels.
Completing the top ten are Fixedfloat.com with 209.82 BTC, Bitfinexs secondary node bfx-lnd1 with 203.96 BTC, Walletofsatoshi with 170.83 BTC across 1,315 channels, OKX at 148.07 BTC, and LNBIG [Hub-1] carrying 125.80 BTC.
Together, these giants serve as the backbone of the Lightning Networks liquidity layer, functioning as primary routes for payment flow. The clustering in 2025 highlights the increasing reliance on a small group of high-capacity operators to keep transactions moving efficiently.
Together, the top ten operators control about 2,389 BTC in liquidityroughly 62% of the 3,8503,870 BTC total observed in late August. Dozens of smaller aliases trail below that line, including Krakens peers like Cyberdyne.sh, Megalithic.me, LOOP, Strike, several LNBIG hubs, Nicehash-ln1, Boltz, and others. Despite the long tail, liquidity remains very top-heavy today.
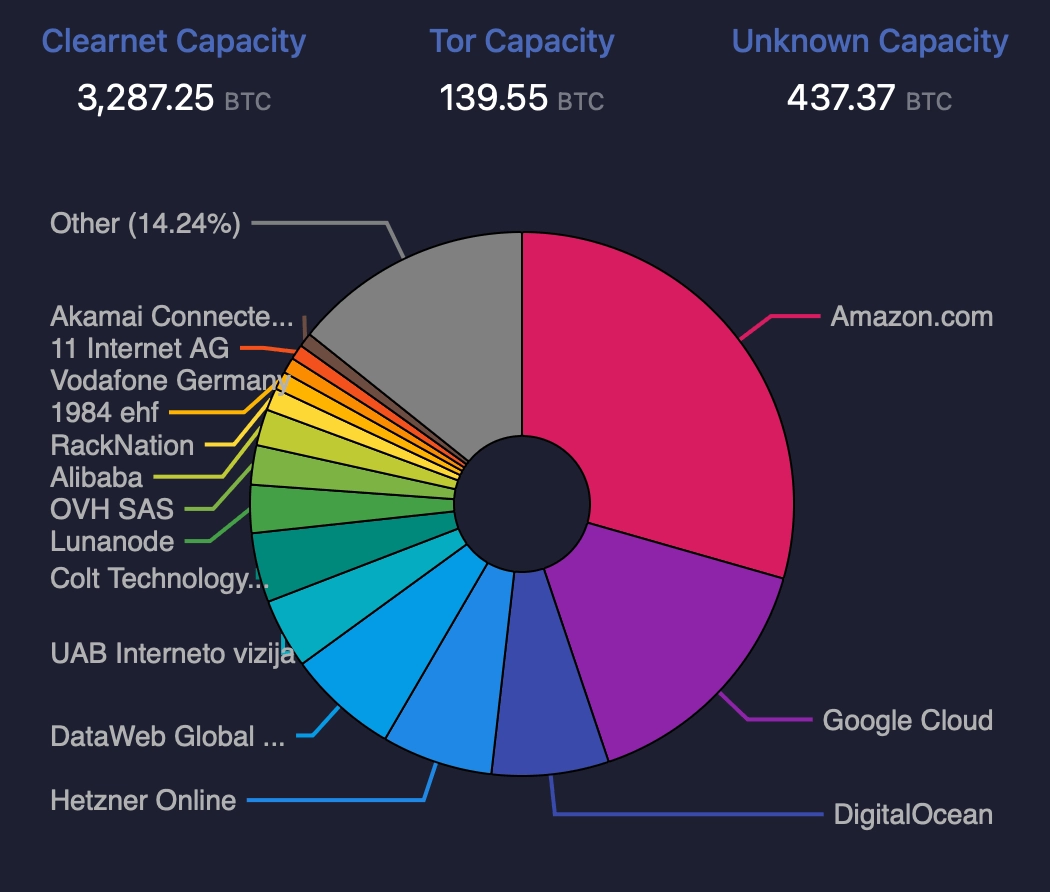
Hosting, too, leans on a few centralized backbones, data shows. Clearnet nodes account for 3,287.25 BTC, while Tor hosts manage 139.55 BTC, and 437.37 BTC cant be pinned to any known provider. A clearnet-only pie chart via mempool.space shows Amazon.com, Google Cloud, Digitalocean, and Hetzner as the main hosts. Smaller fragments go to Dataweb Global, UAB Interneto vizija, and a mix of lesser-known services.
 Source: Mempool.space
The pattern signals a clear reliance on large-scale cloud infrastructure. Tor provides some cover, but clearnet dominates the visible capacity in 2025. Mempools Liquidity Ranking data adds more nuance. Several top-tier nodes log four-digit channel counts: ACINQ (2,245), Walletofsatoshi (1,315), Kraken (1,168), and Bitfinexs two primary nodes (602 and 642). Others, like Binance with 136 channels or fixedfloat.com with 174, lean toward deeper channels with bigger balances.
The contrast shows two strategies in playwider connectivity with smaller sums, or fewer links carrying heavier weight. Regardless of approach, the broader trend points downward for both capacity and channels. Country shares closely track hosting data. Many high-capacity nodes are tied to U.S. locations such as Ashburn, Santa Clara, Columbus, North Charleston, and Boardmanmirroring the countrys dominance in clearnet visibility.
European hubs like Zurich, Nuremberg, Brussels, and Hamburg also appear, along with Zephyr in Canada. Of course, some records omit specifics or list only a country, typical of operators who mask their setups with Tor or choose not to disclose. Viewed in full, the data this year depicts a Lightning Network thats significantly smaller than it was in 2023 and early 2024, with capacity down to around 3.85K BTC and channels trimmed to 41.7K.
Liquidity and infrastructure are still tightly clustered among a short list of operators and providers. Privacy-focused routing continues through Tor, while clearnet exposure leans heavily on U.S.-based setups and major cloud services. What remains consistent is the outsized role of key hubs. ACINQ, major exchanges like Binance, Bitfinex, Kraken, OKX, custodial entities like Walletofsatoshi, and longtime players like LNBIG still serve as the networks backbone.
Their control is evident in both percentages and raw bitcoin totals. Hosting patterns confirm the trendmost exposed capacity is tethered to dominant cloud platforms. In short, the Lightning Network has slimmed down over the past year, both in channel count and on-network balances.
Interestingly, that drop mirrors the slide in onchain transaction volume as well. Activity on the base Bitcoin layer has thinned out, reflecting fewer payments and transfers overallsuggesting the slowdown isnt isolated to Lightning, but part of a broader pullback in usage across the network stack.
But the data does more than highlight the Lightning Networks year-long declineit reveals how todays liquidity is distributed, where the nodes operate, and which providers power the infrastructure that keeps Lightning alive.