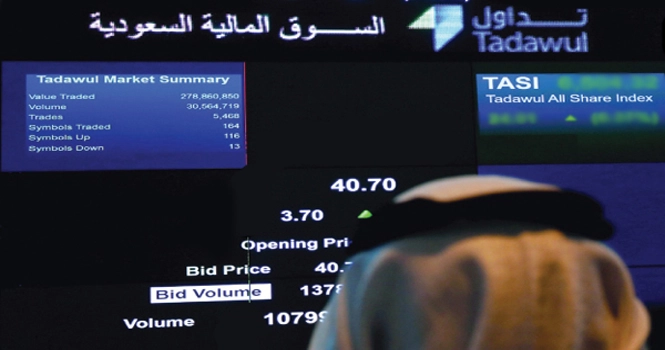
Tadawul trading screen
The market capitalization of the Saudi Exchange (Tadawul) fell 0.25%, or SAR 22.5 billion, week-on- week to about SAR 9.14 trillion in the week ended June 12, according to data issued by Tadawul.
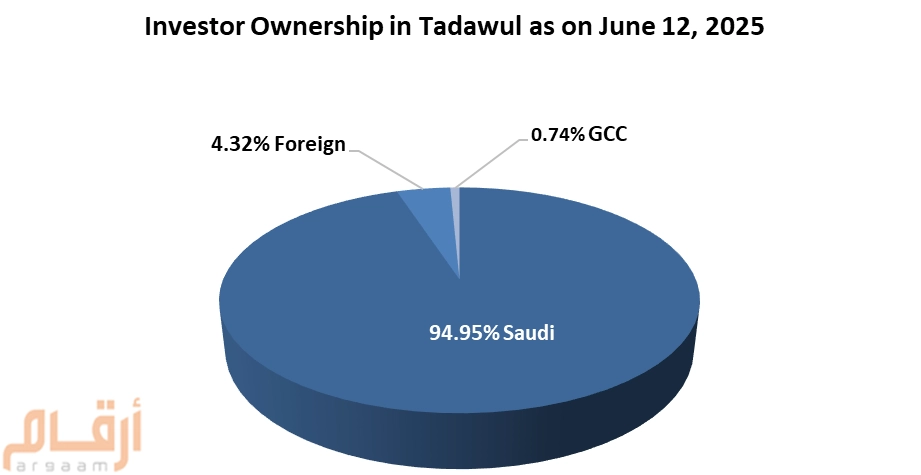
Foreign investors' ownership accounted for 4.32% of the total market capital for the same week.
Ownership Value by Nationality & Investor Type (SAR bln)
Investor Type
June 4, 2025
June 12, 2025
Change (%)
Saudi Investors
Retail
152.75
150.52
(2.23)
High-Net-Worth Investors
255.47
251.35
(4.12)
Individual Professional Investors
463.24
455.59
(7.65)
Individual DPMs
9.54
9.32
(0.22)
Total (Retail)
881.01
866.78
(14.23)
Corporates
1592.71
1581.57
(11.14)
Mutual Funds
292.54
288.53
(4.01)
Government Entities
5886.50
5901.71
15.21
Institutional DPMs
42.53
41.09
(1.44)
Total (Corporate Investors)
7814.29
7812.90
(1.39)
Total (Saudi Investors)
8695.29
8679.68
(15.61)
GCC Investors
Individuals
3.88
3.85
(0.03)
Institutions
64.57
63.09
(1.48)
DPMs
0.53
0.52
(0.01)
Total (GCC Investors)
68.97
67.46
(1.51)
Foreign Investors
SWAP Holders
2.19
2.12
(0.07)
Foreign Residents
17.34
17.12
(0.22)
QFIs
321.82
318.00
(3.82)
DPMs
11.35
11.08
(0.27)
Strategic Investors
47.28
46.25
(1.03)
Total (Foreign Investors)
399.98
394.58
(5.40)
Total
9164.24
9141.71
(22.53)
*Excluding corporate procedures
Ownership Ratio by Nationality & Investor Type
Investor Type
June 4, 2025
June 12, 2025
Change (%)
Issued Shares
Free Float
Issued Shares
Free float
Issued Shares
Free Float
Saudi Investors
Retail
1.67%
4.72%
1.65%
4.70%
(0.02)
(0.02)
High-Net-Worth Investors
2.79%
7.85%
2.75%
7.80%
(0.04)
(0.04)
Individual Professional Investors
5.05%
11.17%
4.98%
11.10%
(0.07)
(0.08)
Individual DPMs
0.10%
0.29%
0.10%
0.29%
--
--
Total (Retail)
9.61%
24.03%
9.48%
23.89%
(0.13)
(0.14)
Corporates
17.38%
41.14%
17.30%
41.30%
(0.08)
0.16%
Mutual Funds
3.19%
7.61%
3.16%
7.58%
(0.04)
(0.03)
Government Entities
64.23%
13.25%
64.56%
13.32%
0.32%
0.07%
Institutional DPMs
0.46%
1.16%
0.45%
1.14%
(0.01)
(0.02)
Total (Corporate Investors)
85.27%
63.16%
85.46%
63.34%
0.19%
0.18%
Total (Saudi Investors)
94.88%
87.20%
94.95%
87.23%
0.06%
0.04%
GCC Investors
Individuals
0.04%
0.13%
0.04%
0.13%
--
--
Institutions
0.70%
1.26%
0.69%
1.26%
(0.01)
--
DPMs
0.01%
0.02%
0.01%
0.02%
--
--
Total (GCC Investors)
0.75%
1.40%
0.74%
1.40%
(0.01)
--
Foreign Investors
SWAP Holders
0.02%
0.07%
0.02%
0.07%
--
--
Foreign Residents
0.19%
0.55%
0.19%
0.55%
--
--
QFIs
3.51%
10.41%
3.48%
10.39%
(0.03)
(0.02)
DPMs
0.12%
0.37%
0.12%
0.36%
--
(0.01)
Strategic Investors
0.52%
--
0.51%
--
(0.01)
--
Total (Foreign Investors)
4.36%
11.40%
4.32%
11.37%
(0.05)
(0.03)
Ownership Value & Ratio by Investor Classification (SAR bln)
Investor Classification
June 4, 2025
June 12, 2025
Change in Ownership
Equity
Issued Shares
Free Float
Equity
Issued Shares
Free Float
Institutional
8734.80
95.31%
86.75%
8718.87
95.37%
86.82%
(15.93)
Non-Institutional
429.44
4.69%
13.25%
422.84
4.63%
13.18%
(6.60)
Total
9164.24
100%
100%
9141.71
100%
100%
(22.53)
- Investor Ownership Percentage